

See per channel what you sell and what you keep
Webshop, till and marketplaces run through the same administration in Afosto. The built-in analytics overview shows per channel what you turn over, which products move and what margin you make. No exports, no spreadsheet.





The retailers and wholesalers getting their numbers from Afosto
Trusted by ambitious retailers












What is e-commerce analytics?
E-commerce analytics is collecting and analysing your sales data: how much you turn over, through which channels, which products move and what you keep from it. The aim is simple: decide on numbers instead of gut feeling. In practice that is harder than it sounds, because the data is spread out. The webshop reports in its own dashboard, the till in the one from the till supplier and the marketplace in a third environment. In Afosto all those sales run through the same order management system, and your reporting benefits from that directly:
No data warehouse, no connections, no overnight sync: the overview looks straight at the orders that run through your administration anyway.
All channels in one overview
revenue per sales channel and per country, side by side instead of split across three dashboards
Margin instead of just revenue
cost price, sales price and margin per product, as a percentage and in euros
Compare periods
from today to the last three months or your own date range, set against the period before
Measuring without hassle
Your numbers, without spreadsheets and connections
Administration for webshop, till and marketplaces
Period filters, from today to your own date range
Live
Numbers up to and including today, straight from your order flow
Separate BI licence needed: analytics is included in your plan
How it works
From order to insight, without exports
Every order, receipt and marketplace order records its data in the same order flow. Analytics looks at exactly that flow, so your numbers never lag behind your administration. This is what it looks like, from sale to decision.
- Step 1
Every sale in the same order flow
A webshop order, a card payment in the shop or a bol.com order: everything comes in as an order in the same BackOffice. Invoices, parcels, stock levels and stock movements sit next to it, in the same environment. That is the source your numbers run on.
 afosto.app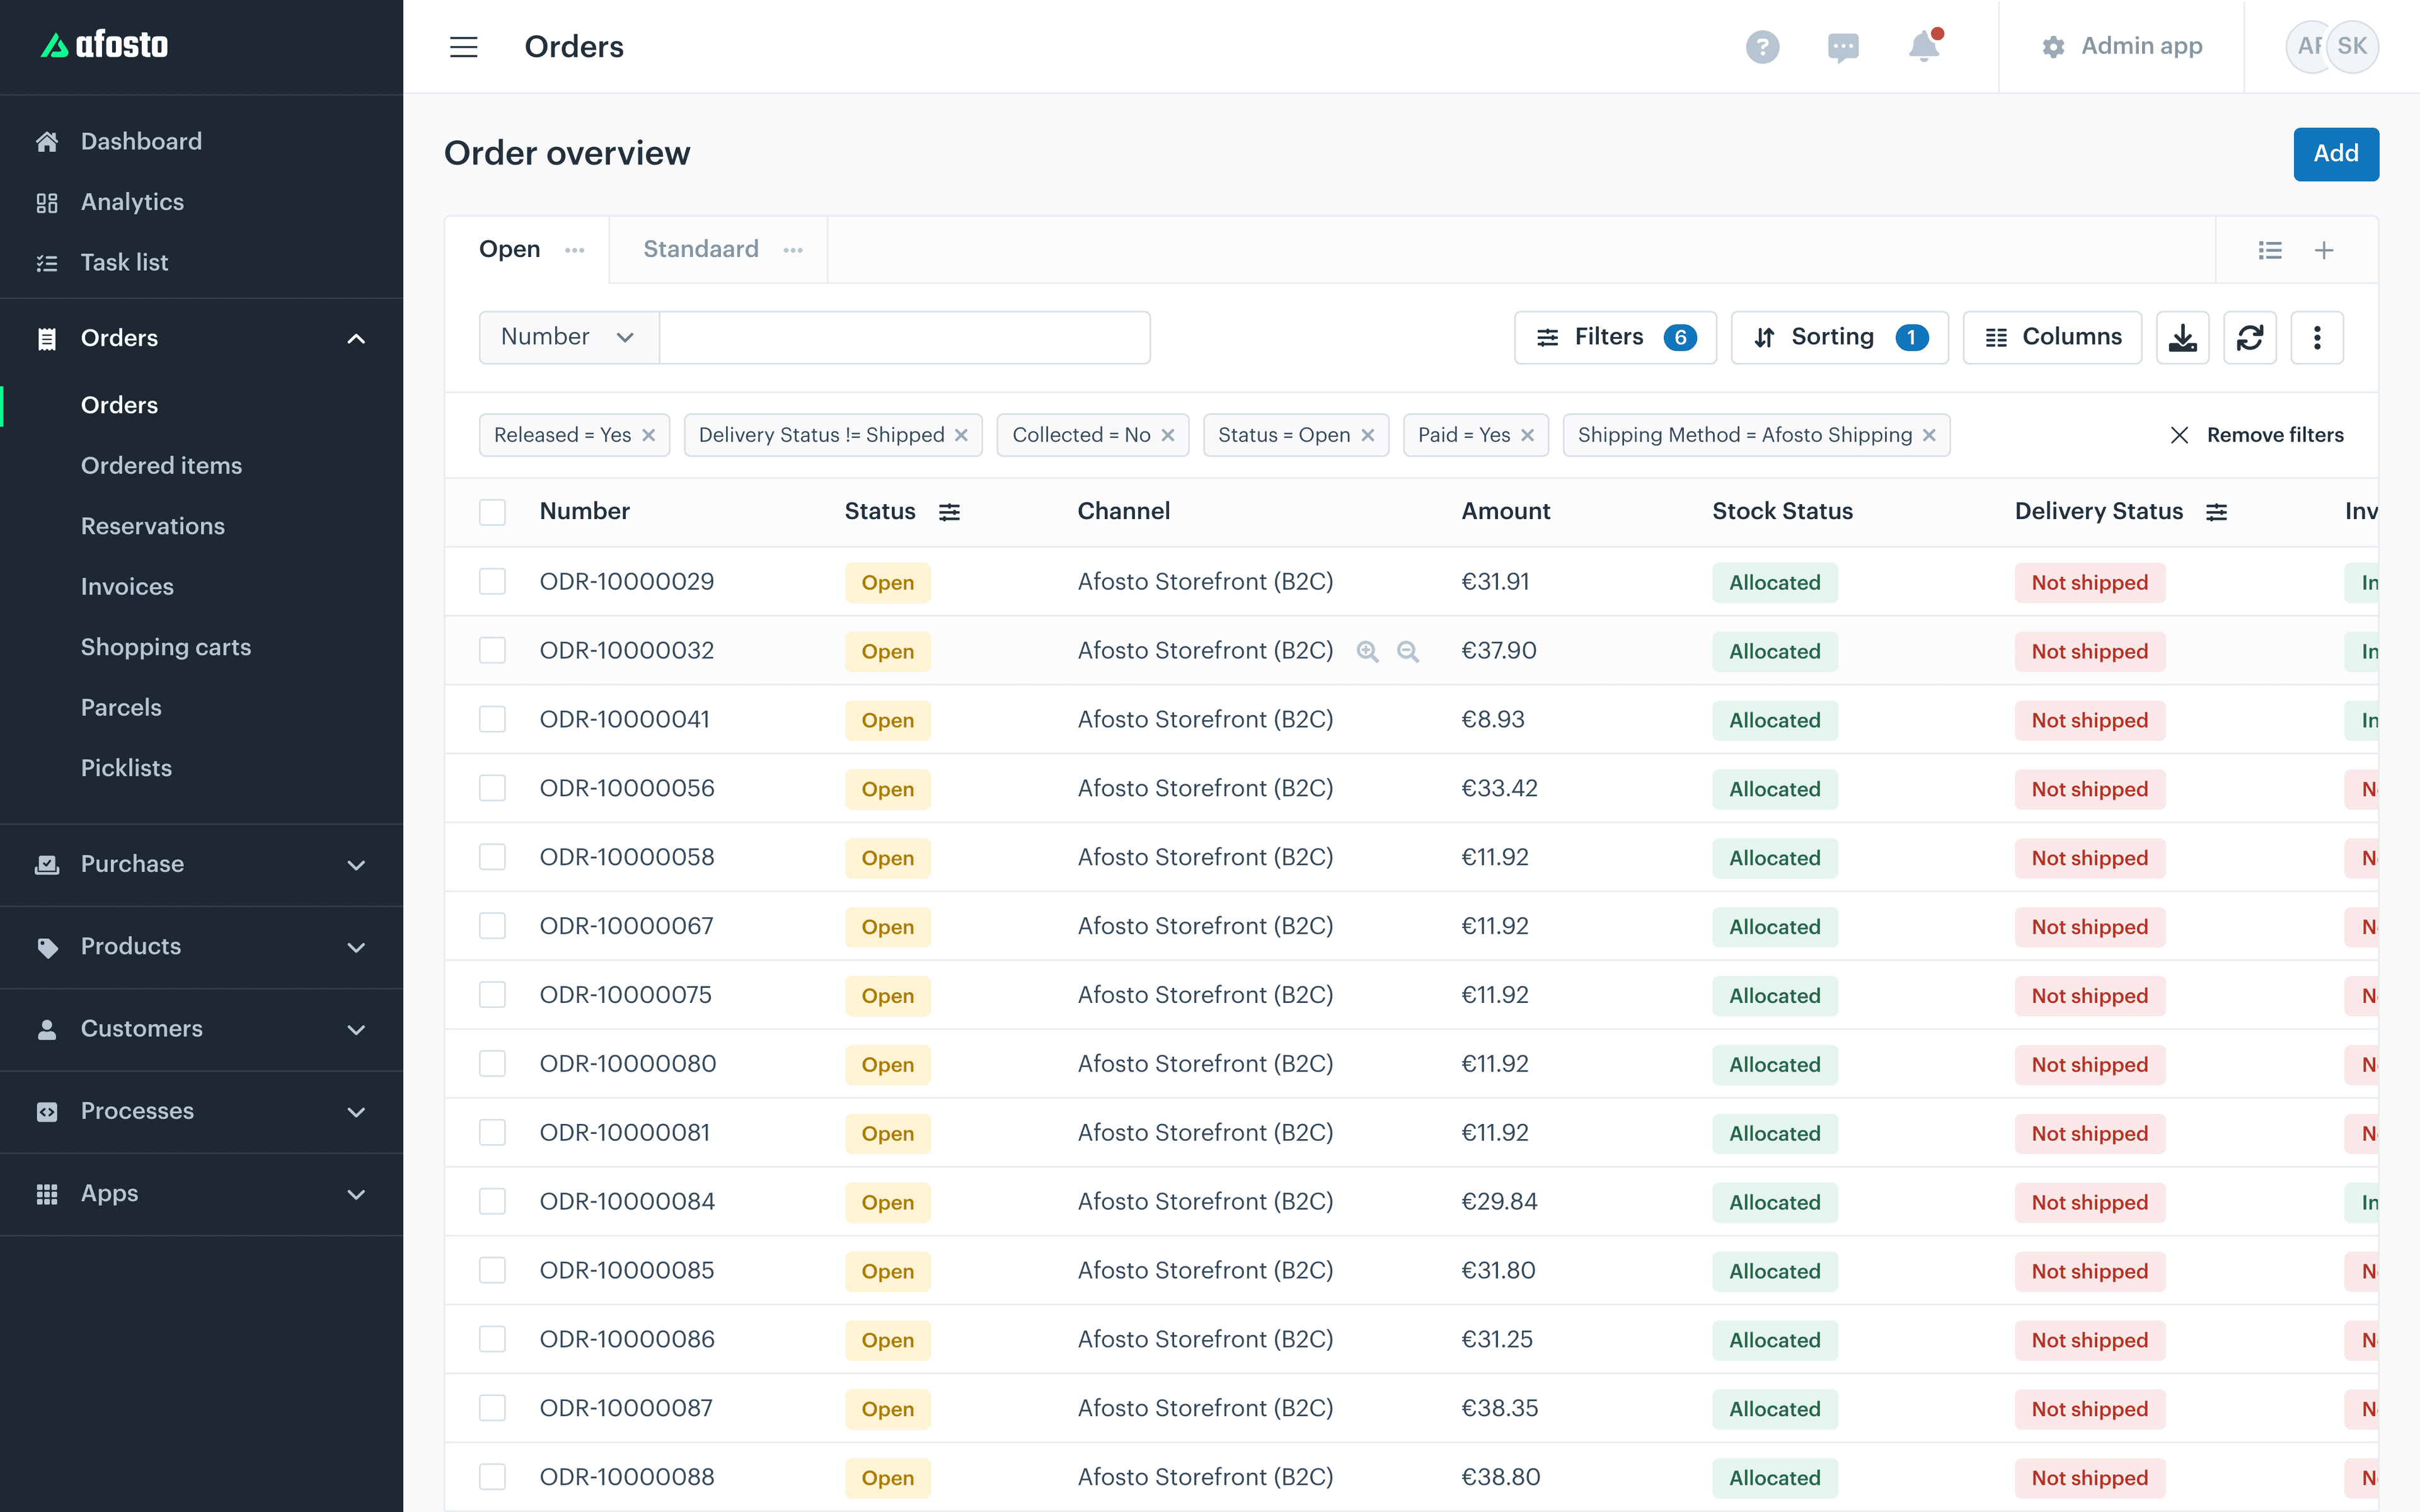
- Step 2
Revenue per channel and per country
Open Analytics and see your revenue broken down per sales channel and per country. That way you compare at a glance what your B2B webshop, your B2C webshop, your till and your marketplaces contribute. Filter on a channel or pick another period and the tables recalculate straight away.

- Step 3
Margin and top sellers per product
The Products tab shows your revenue, the number of products sold and your average and total margin over the chosen period. Below that are your best-selling products, each with cost price, sales price, revenue and margin in percentages and euros. That way you see not only what moves, but also what pays off.

- Step 4
Start your day with today’s figures
The BackOffice home page opens with your total revenue, average order value and number of orders for today, yesterday, this week, this month or this quarter. Plus what is ready to ship now. One morning glance and you know whether it is running.

Need more? Through the API you pull the same data for your own analyses, including the margin per order.
Taking your data further
The analytics overview answers the daily questions. For everything around it, Afosto has the building blocks on board, from till reports that belong to the point of sale system to events for your marketing data:
Want to see the person behind the numbers? The order history and profile of every customer sit in the CRM, linked to the same orders.
Margin per order through the API
revenue set against the purchase value and external costs like transport, marketing and commission, per order and per order line
Close till sessions cleanly
a report per session with opening balance, expected and counted closing balance, skimmed amount and all cash movements
Server-side tracking
send commerce events like purchases, checkout starts, cancellations and returns per sales channel to Google Analytics, for example
CSV export
export list views, from orders to stock movements, as CSV for your own processing
FAQ
Frequently asked questions about e-commerce analytics in Afosto
The questions retailers and wholesalers ask us most often about the analytics overview.
Which statistics does the analytics overview show?
Two angles. Orders: your revenue broken down per sales channel and per country. Products: your revenue, the number of products sold, your average and total margin, and a ranking of best-selling products with cost price, sales price, revenue and margin per product. On top of that the BackOffice home page opens with your total revenue, average order value and number of orders for today, this week, this month or this quarter.
Can I see revenue per sales channel?
Yes. In Afosto every sale carries the channel it comes from: your webshop, your till or a marketplace connection. The analytics overview puts those channels side by side, so you see what each channel contributes. You can also filter on a specific channel.
How does Afosto calculate the margin per product?
Based on the cost price and the sales price of every product sold. You see the margin per product as a percentage and in euros, plus the average and total margin over the chosen period. The condition is that the cost price is filled in on the product; products without a cost price show revenue but no margin. Through the API you can also request the margin per order, including external costs like transport and commission.
Can I set and compare periods?
Yes. You choose from today, yesterday, the last 7 days, the last 30 days, the last 3 months or your own date range. The numbers can be set against the period before, so you see growth or a dip straight away.
Do I need a separate BI tool or connection?
No. The analytics overview sits in the same BackOffice where you manage your orders, stock and customers, and looks straight at your order flow. If you do want to use data elsewhere, you can: you export list views as CSV, you send commerce events server-side to Google Analytics for example, and through the API you pull the underlying data for your own analyses.
What does analytics cost with Afosto?
Nothing extra. The overview is part of your Afosto plan; there is no separate analytics module or BI licence. It is available for users with an admin role, so you decide yourself who has insight into revenue and margin.
Know this afternoon what your channels did today
Create a free account and see your own revenue, margin and channels in the analytics overview as soon as your first orders come in. Or book a demo and we will show it with data that resembles your situation.